AI Overviews & AI Mode
Defined the UX framework spanning the entire shopping query stream via system instructions and design components. Impact: 50%+ increase in AI Overviews interactions; new UIs increased net ad revenue in AI Mode by 13.2%.
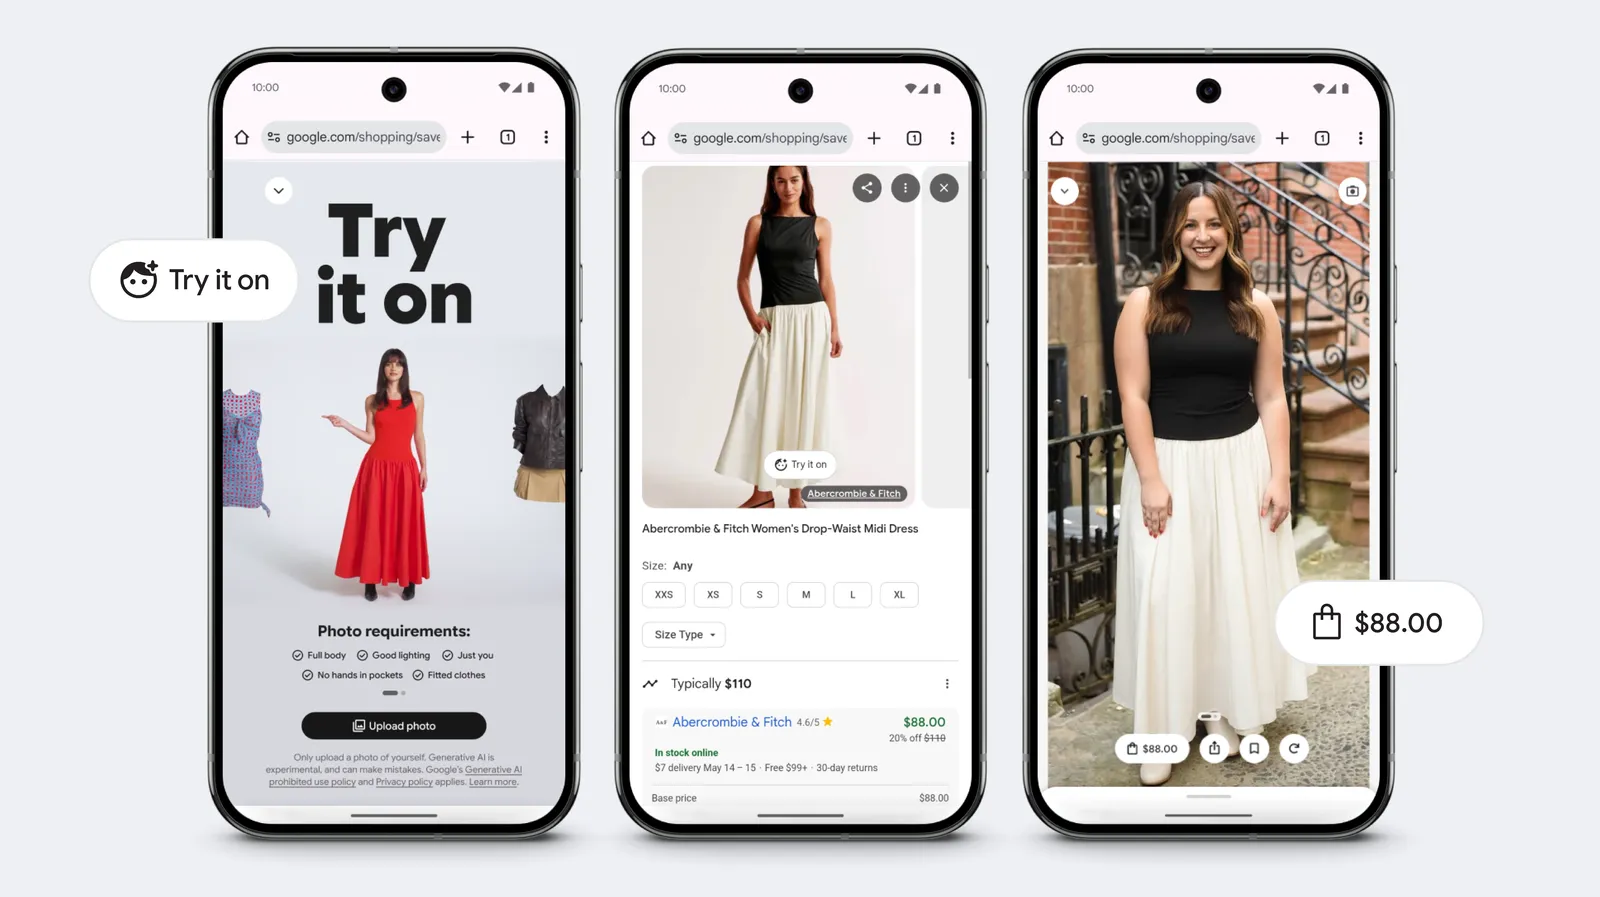
Try-on-You
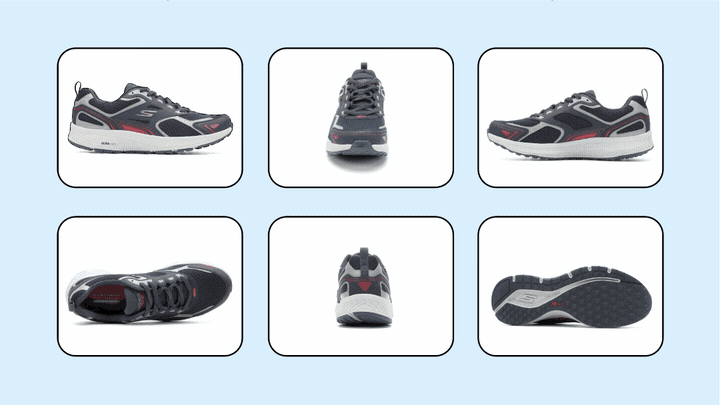
Shipped the first at-scale, online-processed generative UI feature on Search. Impact: the most-shared Google Search feature of all time.
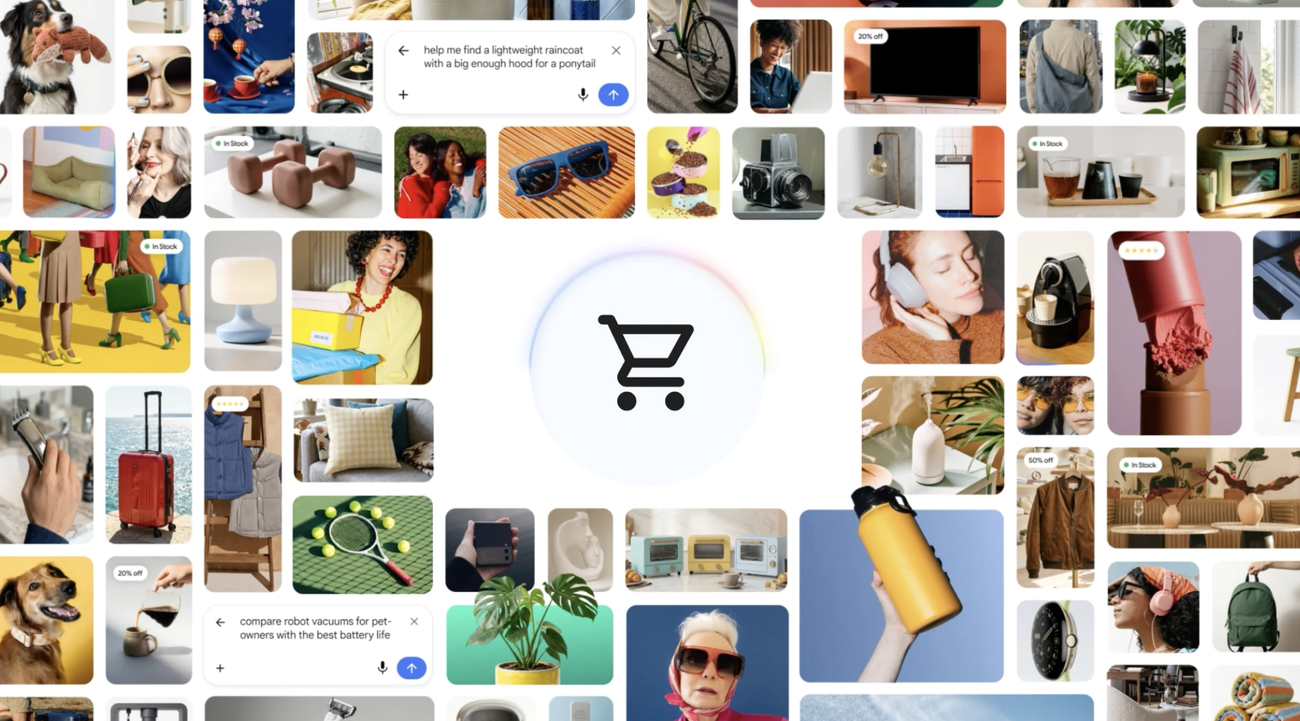
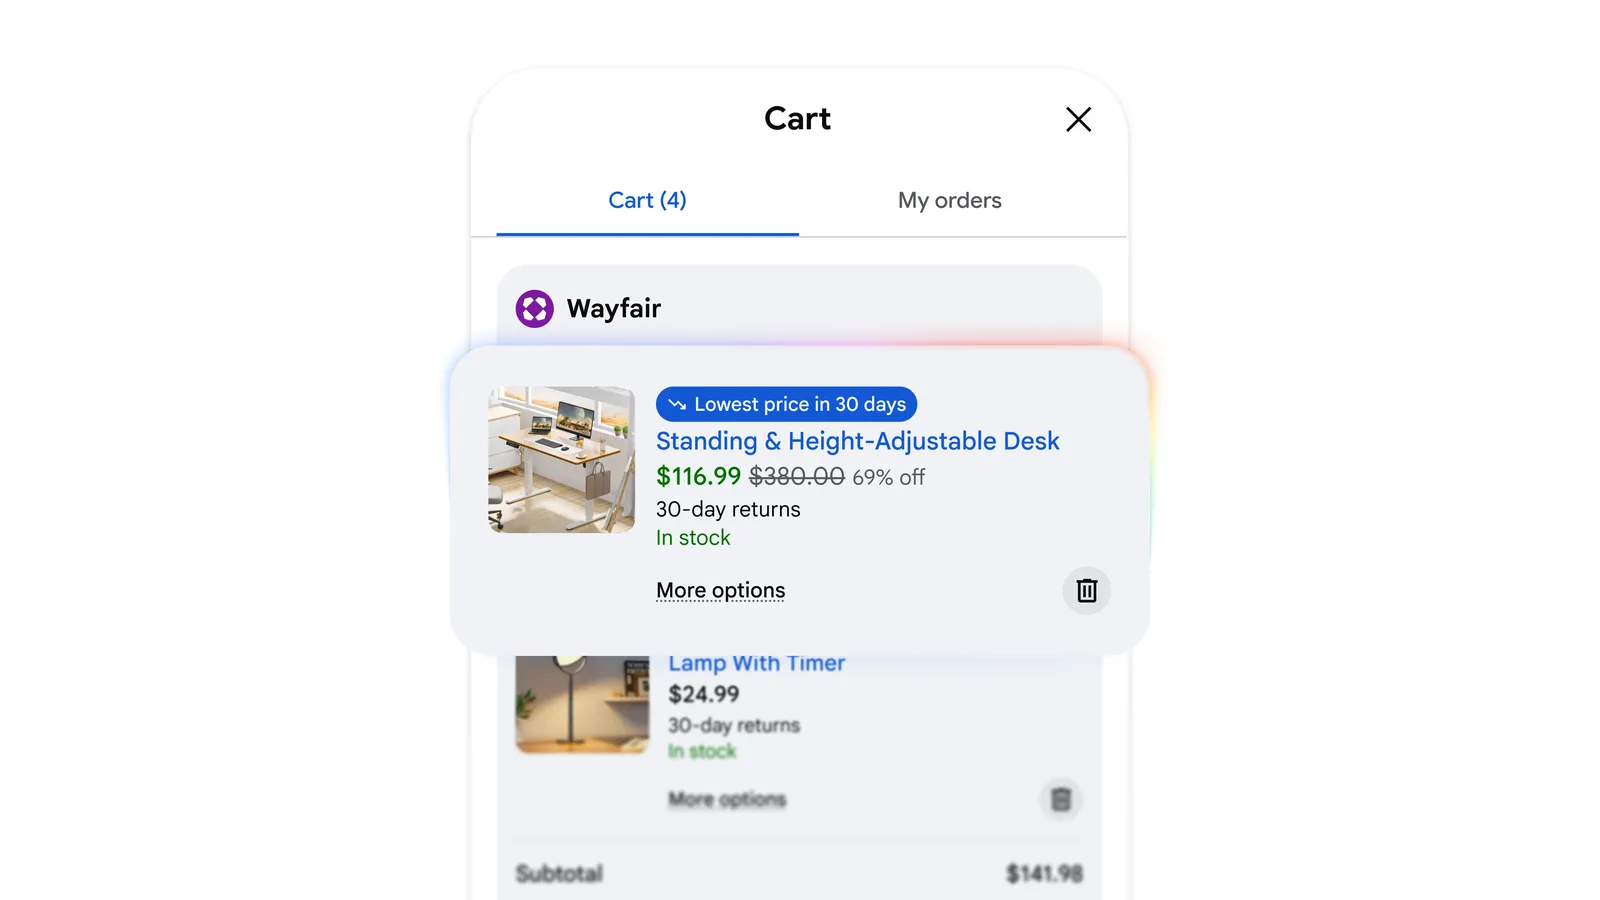
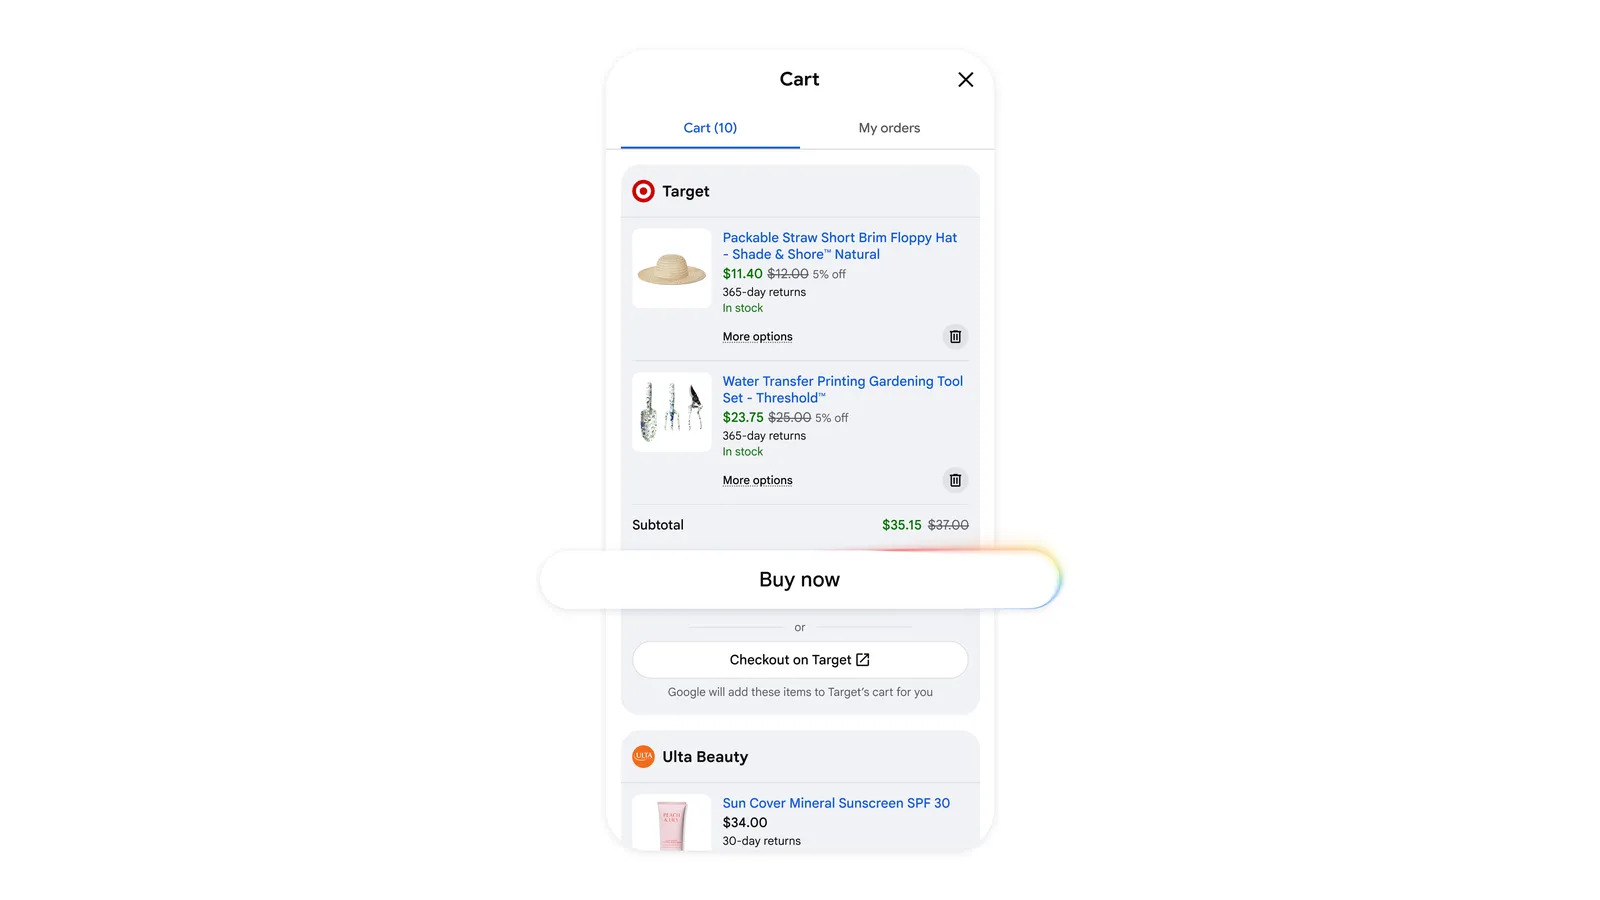
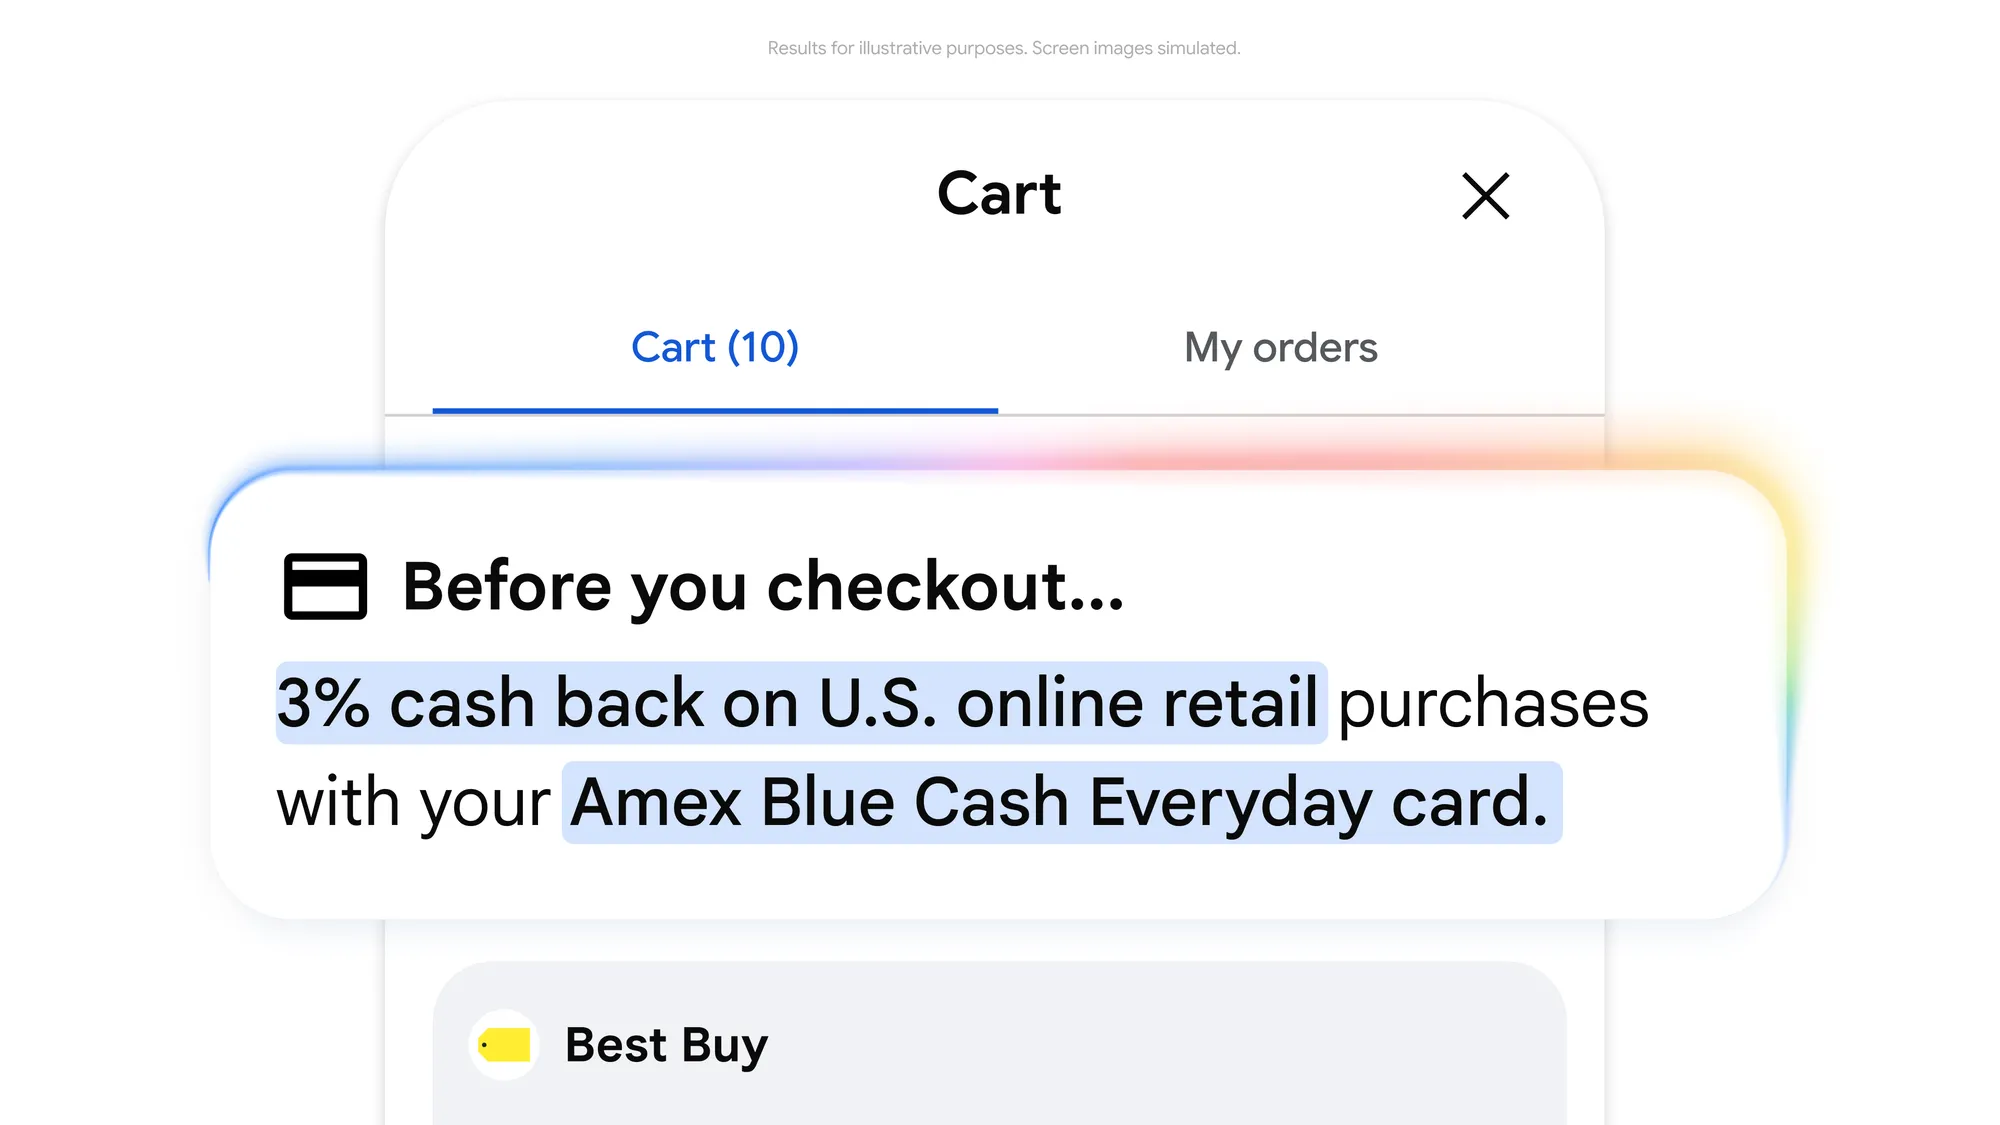
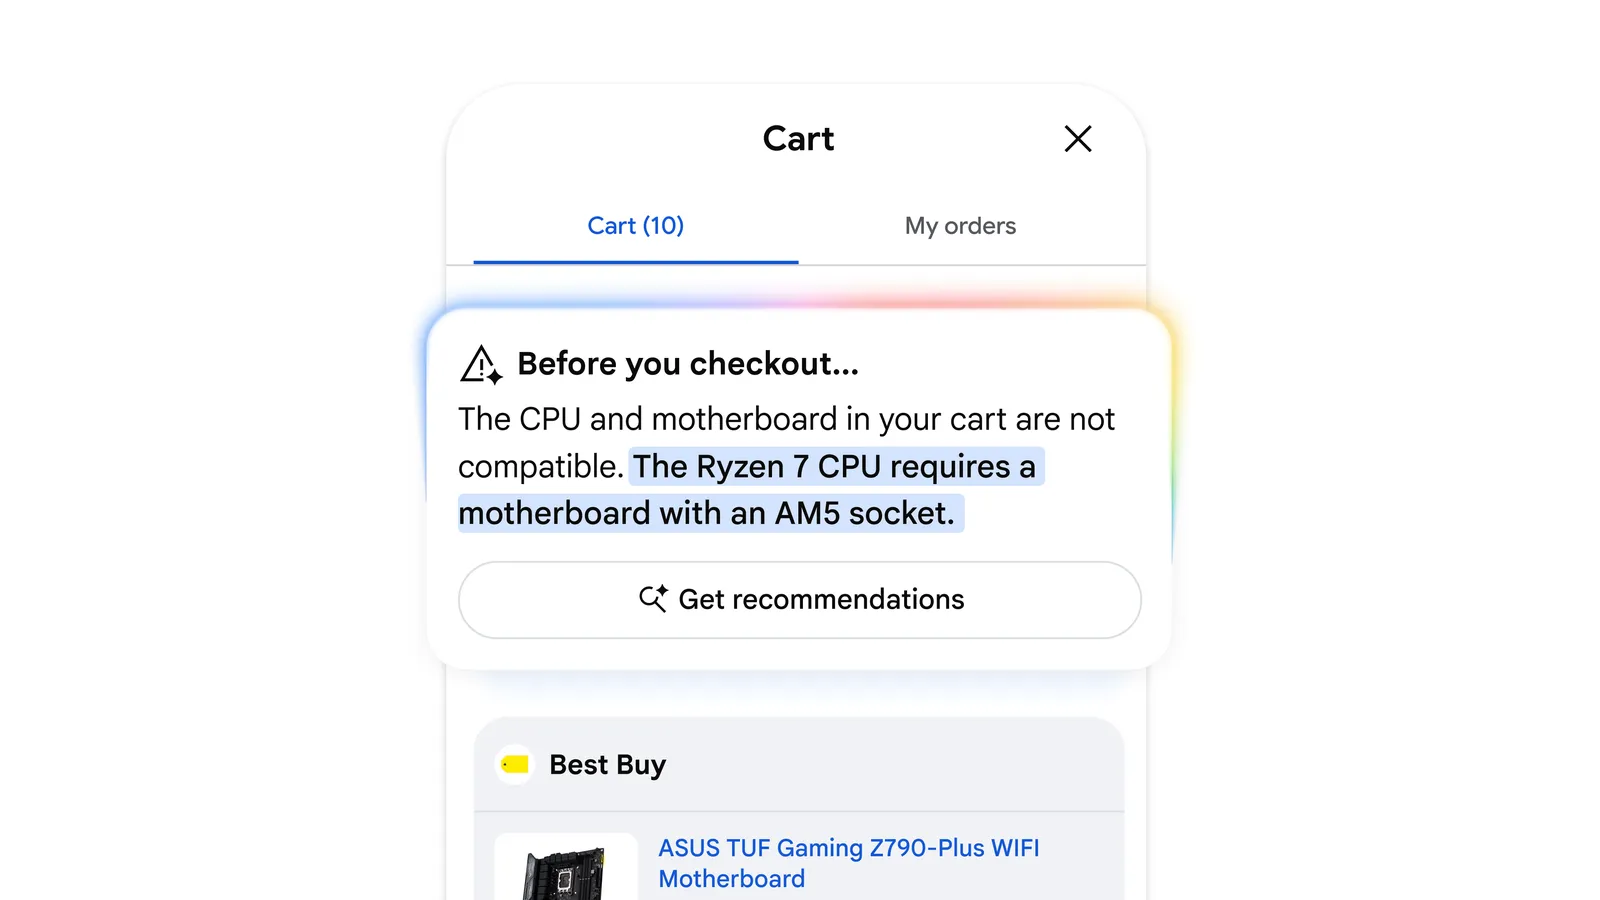
Universal Cart and UCP
Led UX and launched across Google products (Search, YouTube, Gmail, Gemini) with the ability to purchase directly on Google.
Ads + organic strategy
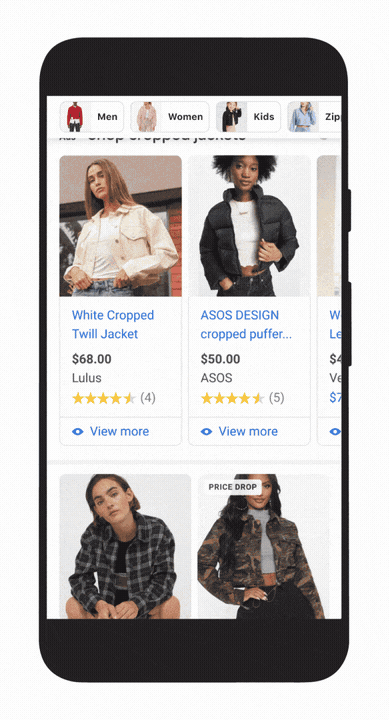
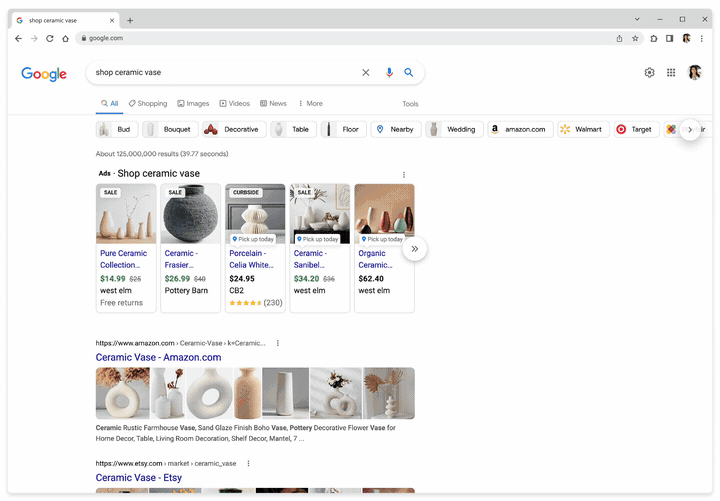
Co-defined and designed the first Search page interleaving ads and organic results. Impact: >3× revenue uplift. Nick Fox, SVP of Search: “strong impact across metrics.”
Google SRP redesign
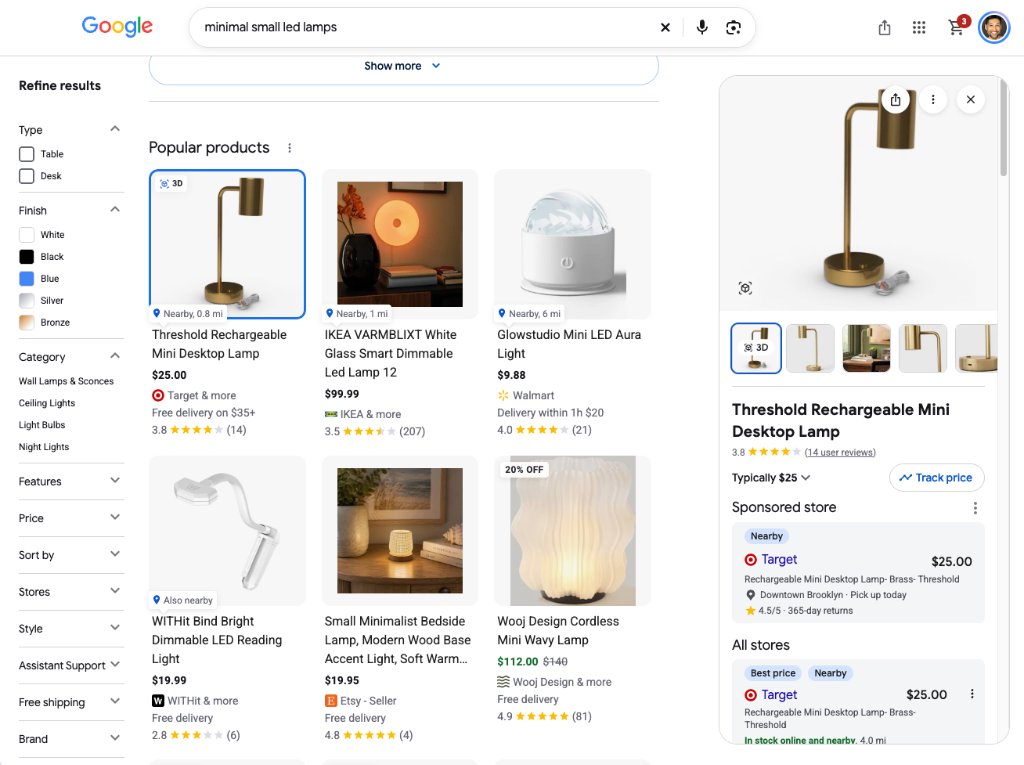
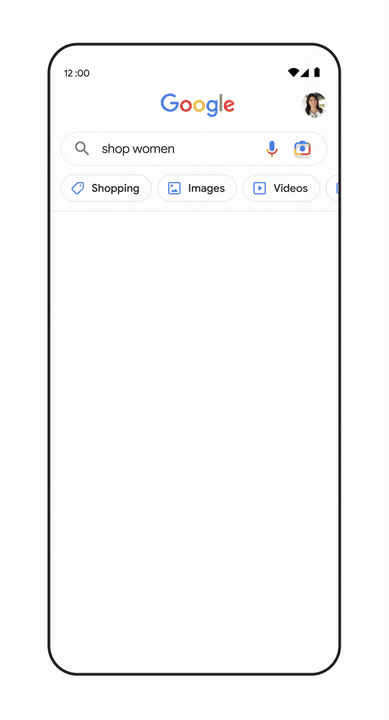
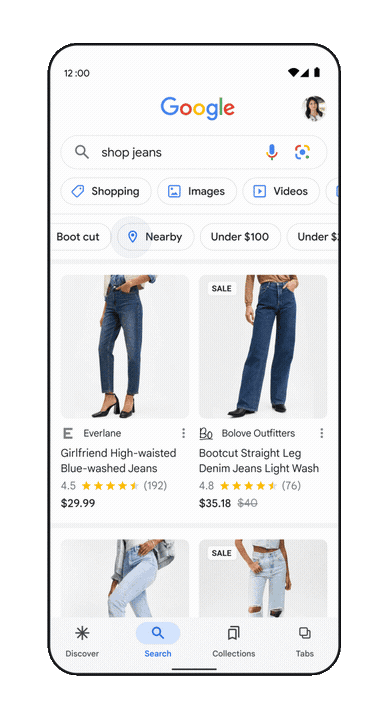
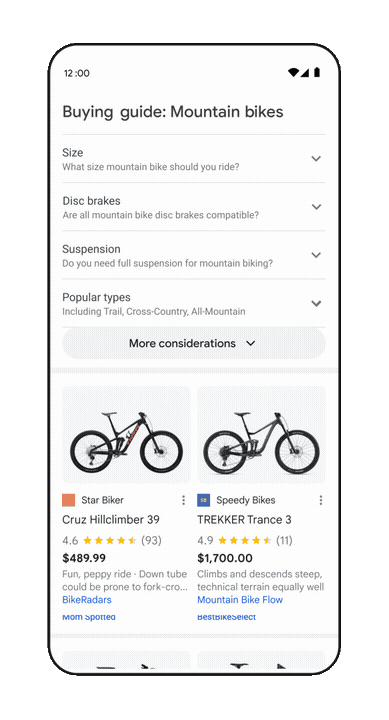
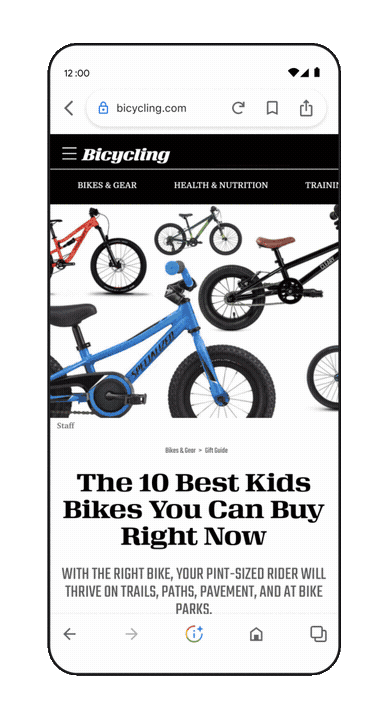
Led UX for a team of ~10 PMs and 40+ engineers across Search and Ads in 4 time zones that transformed Google result pages from text-first to visual-first. Launched in 9 months: +14% user preference across ~10% of US English mobile traffic; +0.3% query growth.
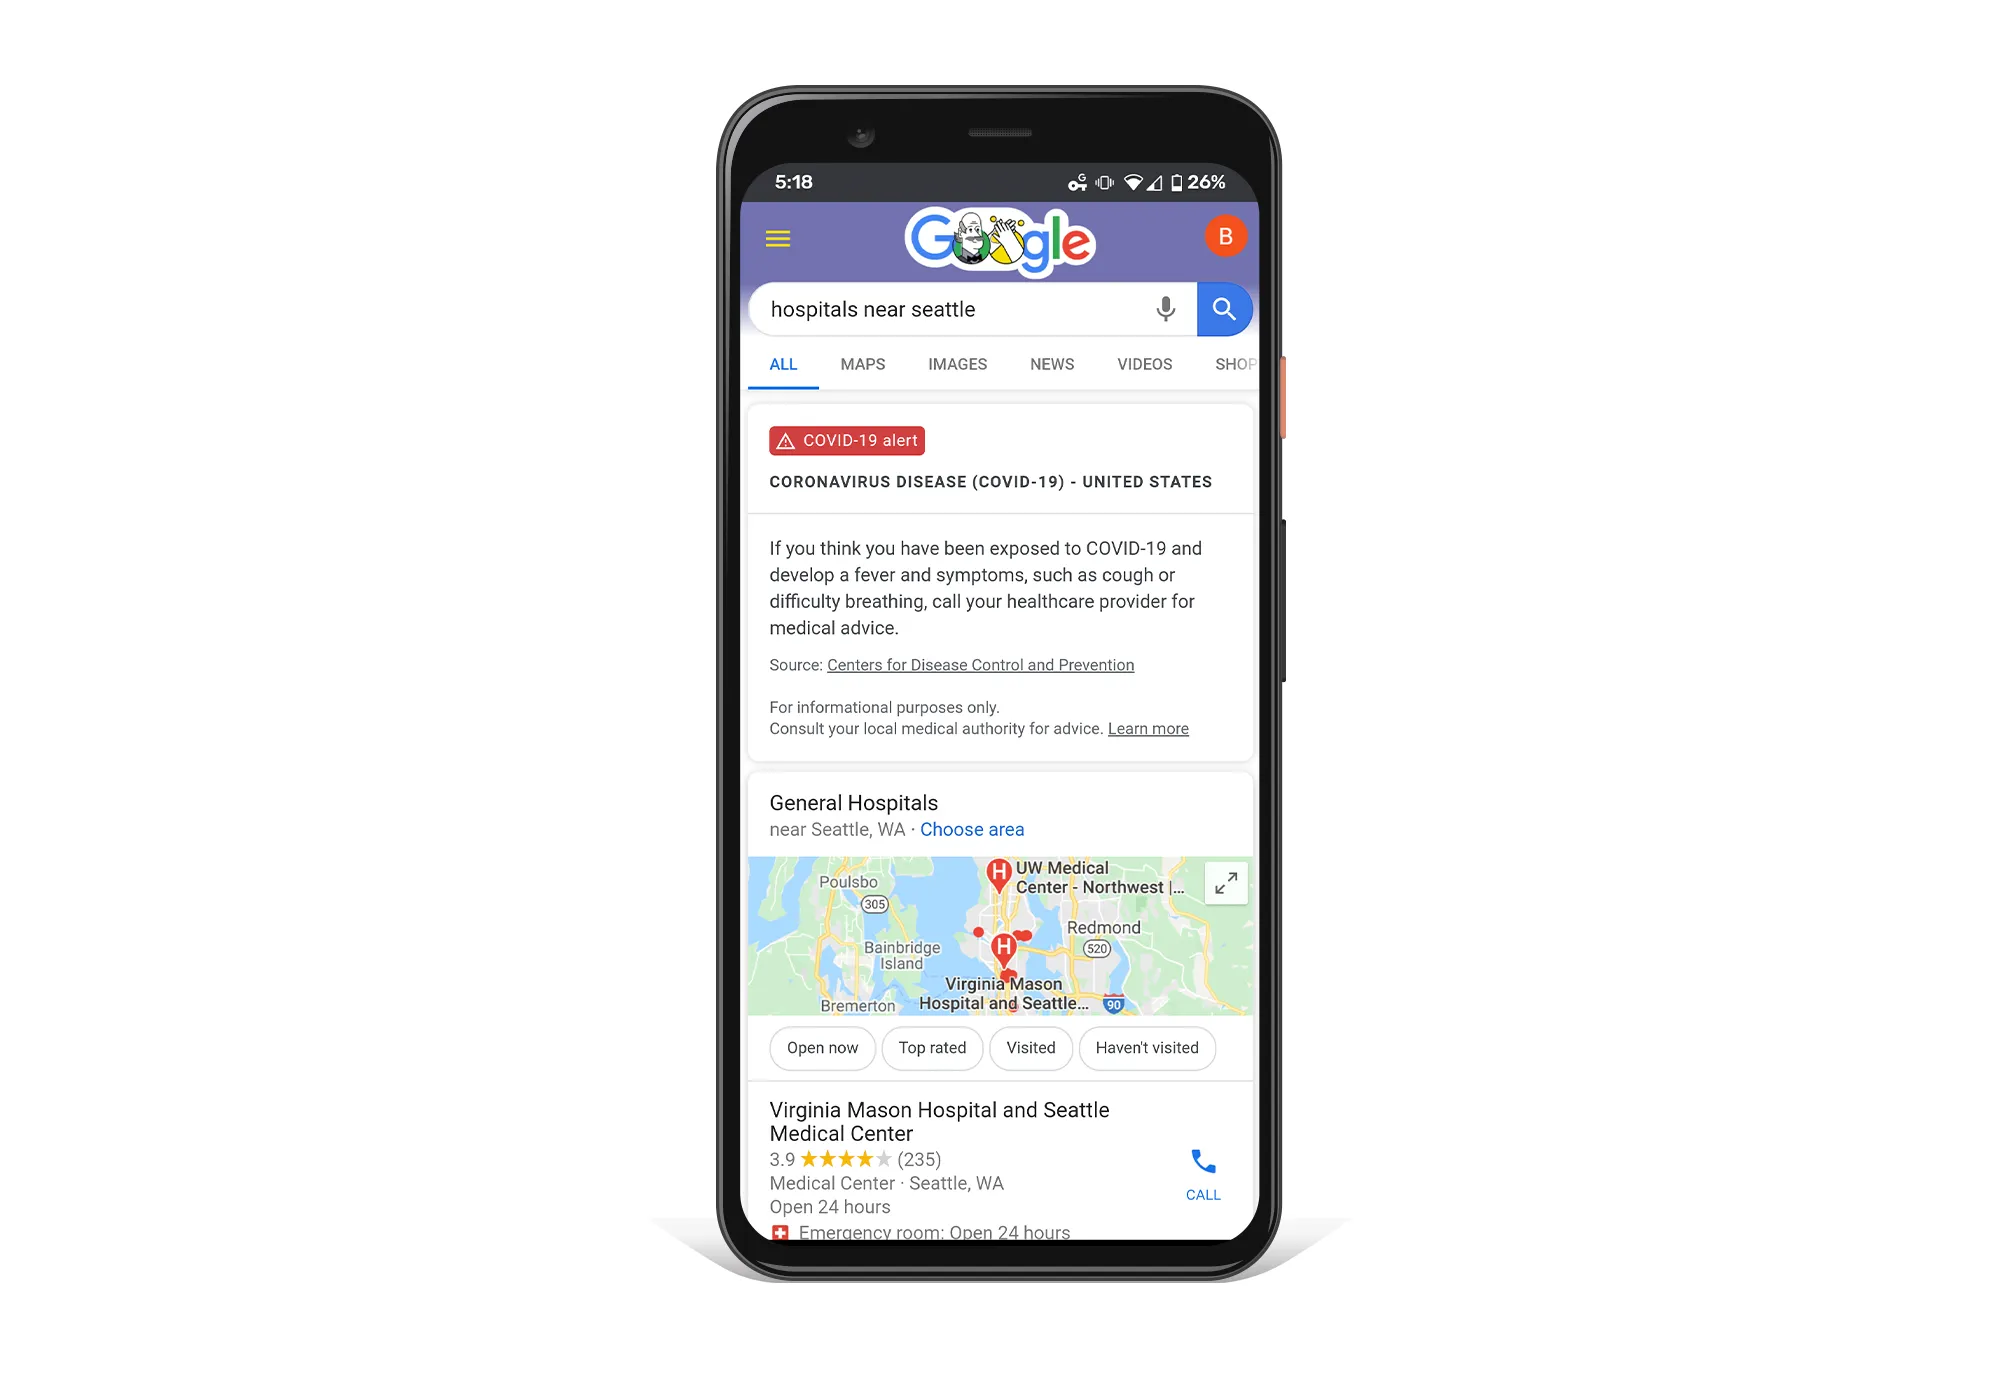
Led UX and shipped COVID features (occurrence rates, trusted health information, international governmental data visualizations) in 3 weeks; scaled to 52 languages and 83 countries with follow-the-sun teams. Impact: 9.8B impressions, 110M peak DAU.
Pitched and shipped features for ~51% of all Search queries. Selected verticals below; others included education problem solving, college knowledge panels, Google Books and Translate on Search.
Sports
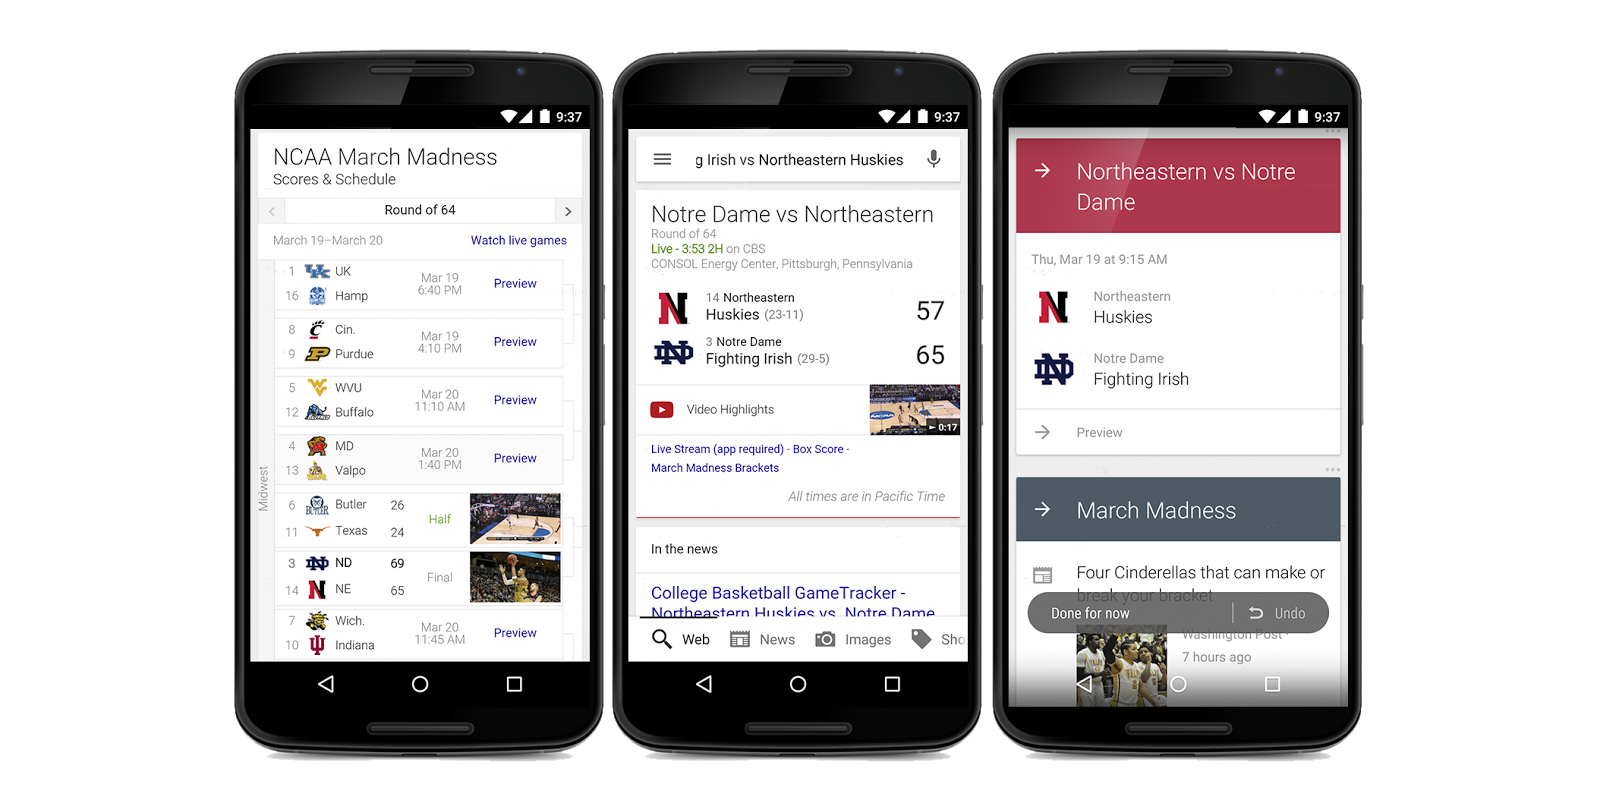
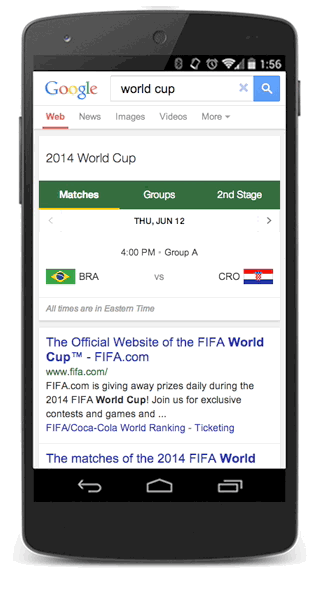
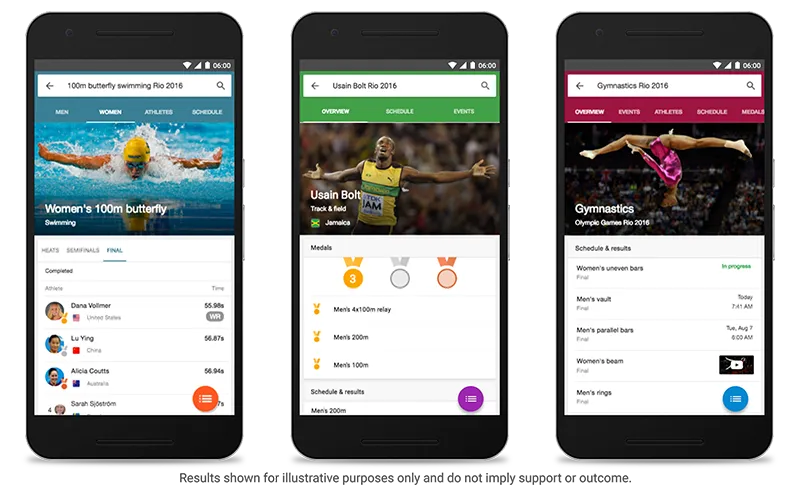
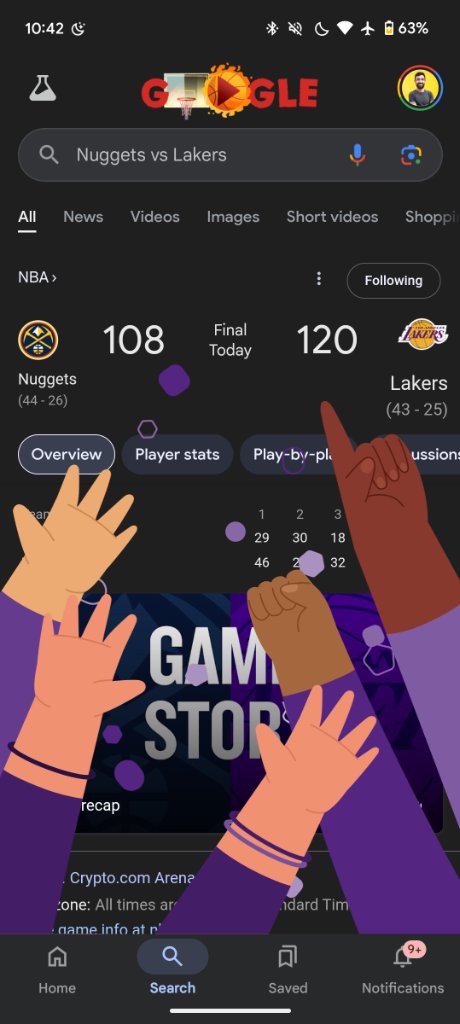
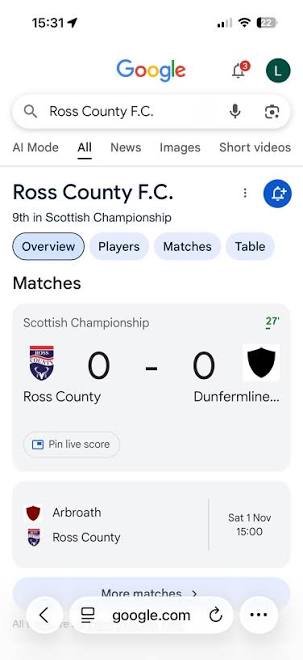
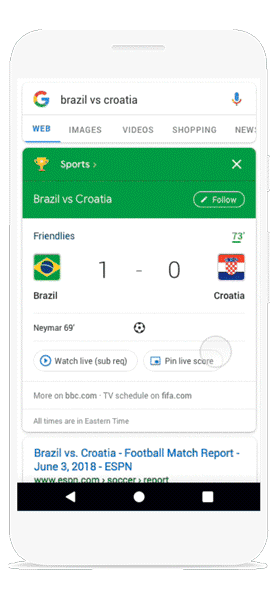
Live scores, schedules and full-screen experiences for 170 leagues in 70 countries, including the World Cup, NCAA tournament and the Olympics.
Elections
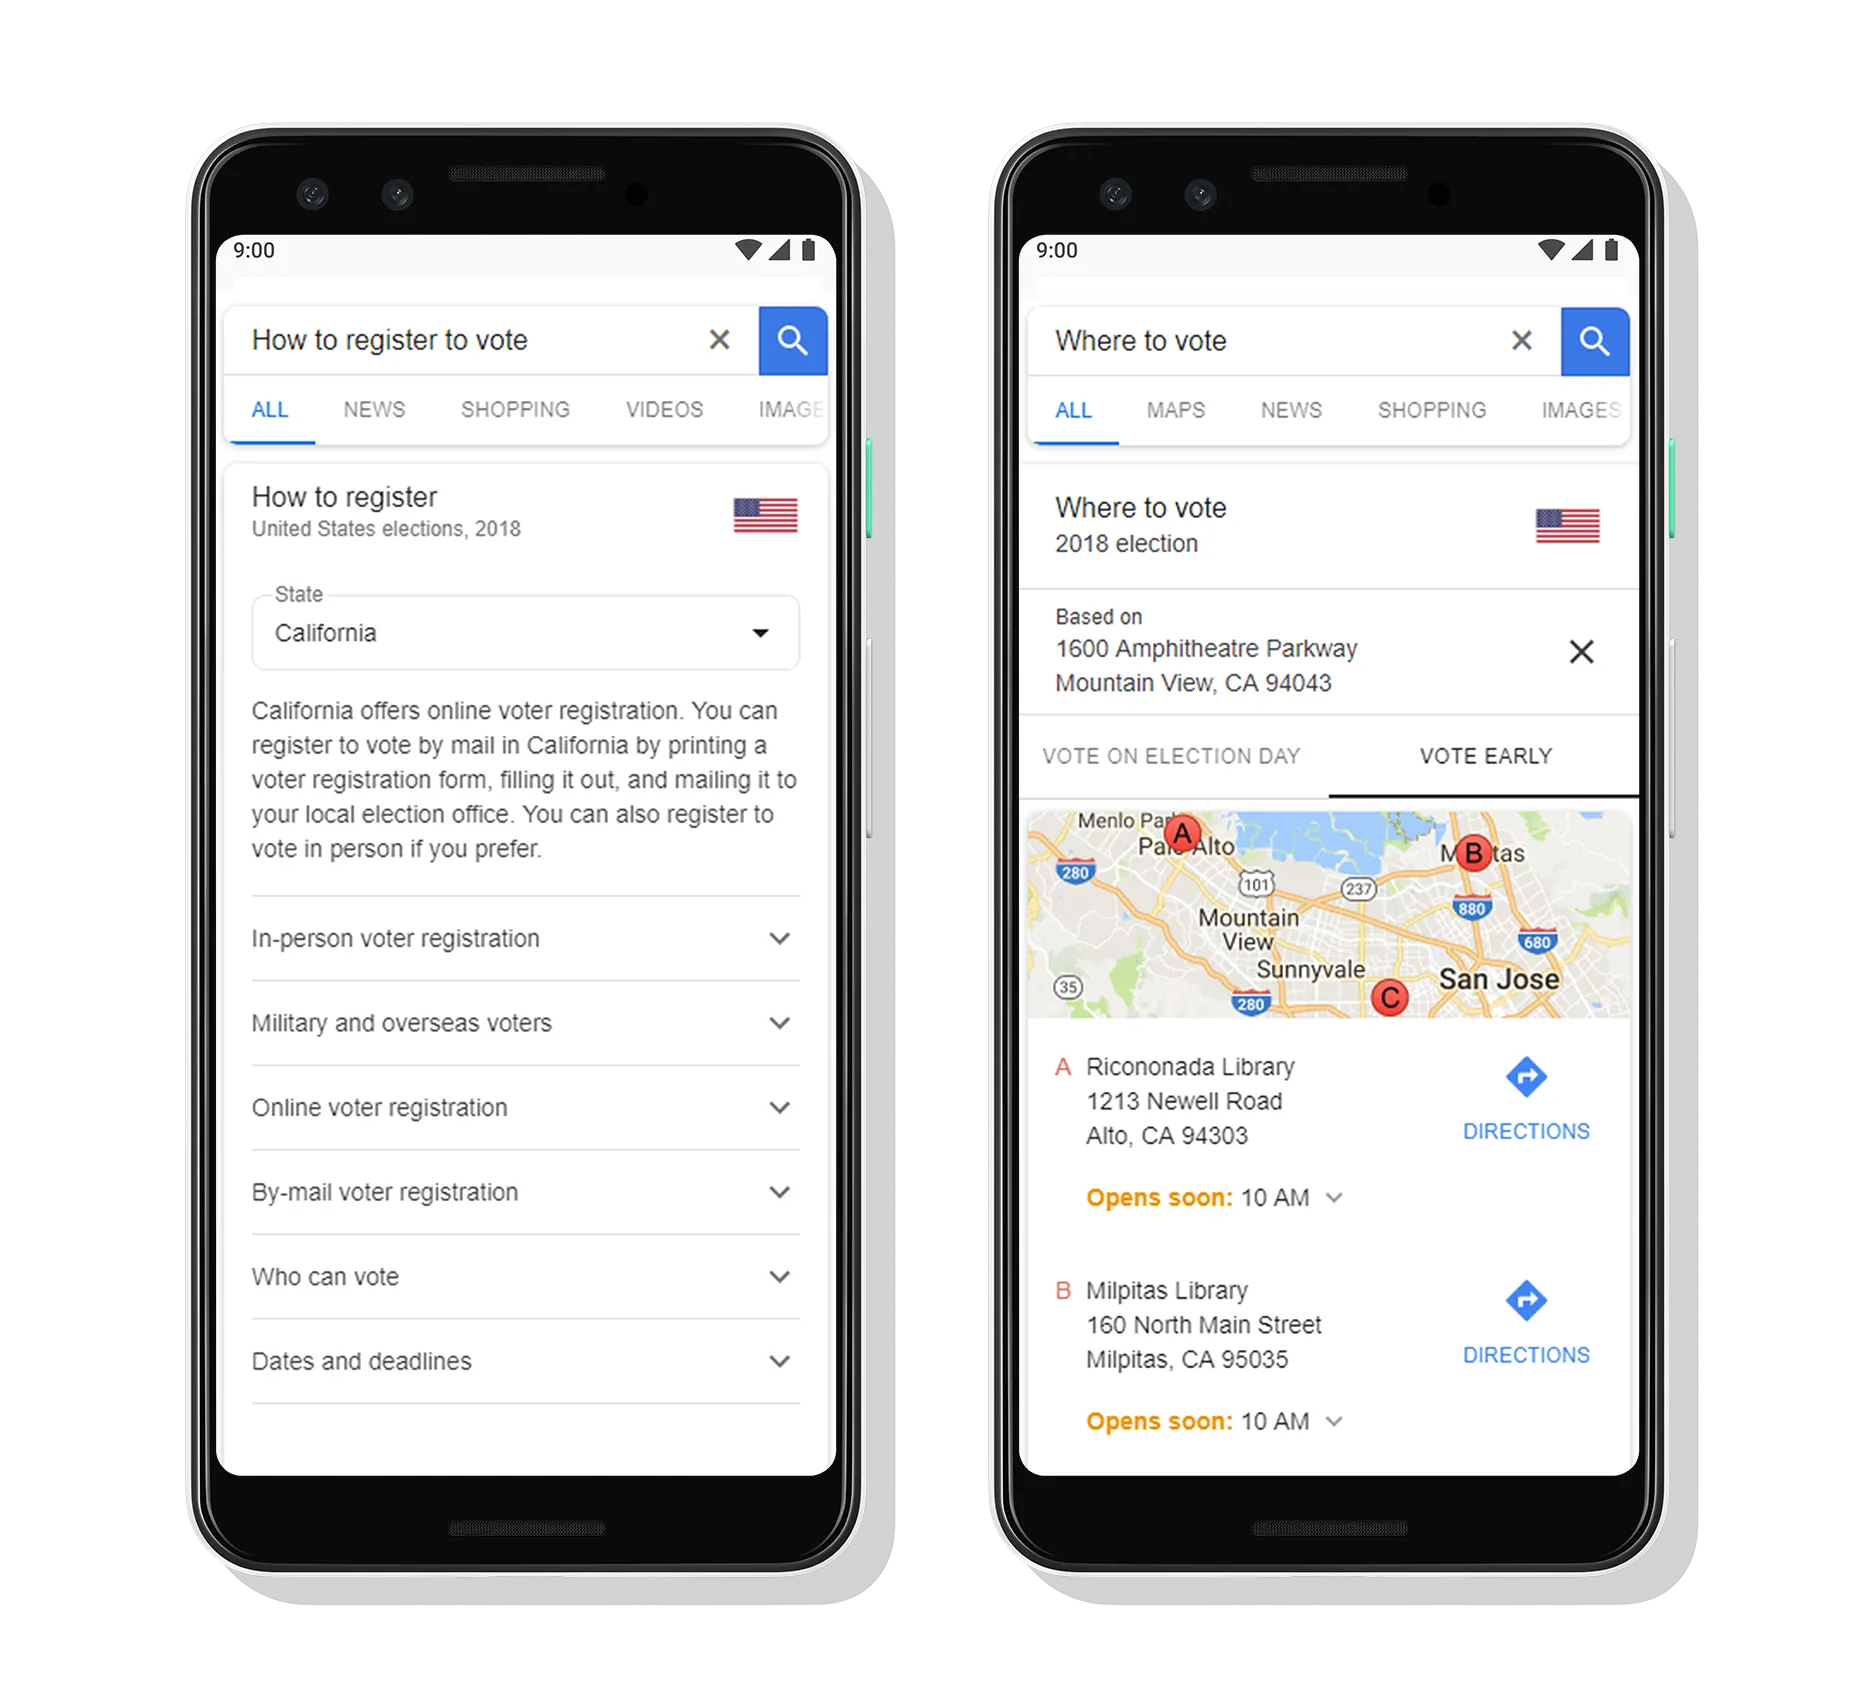
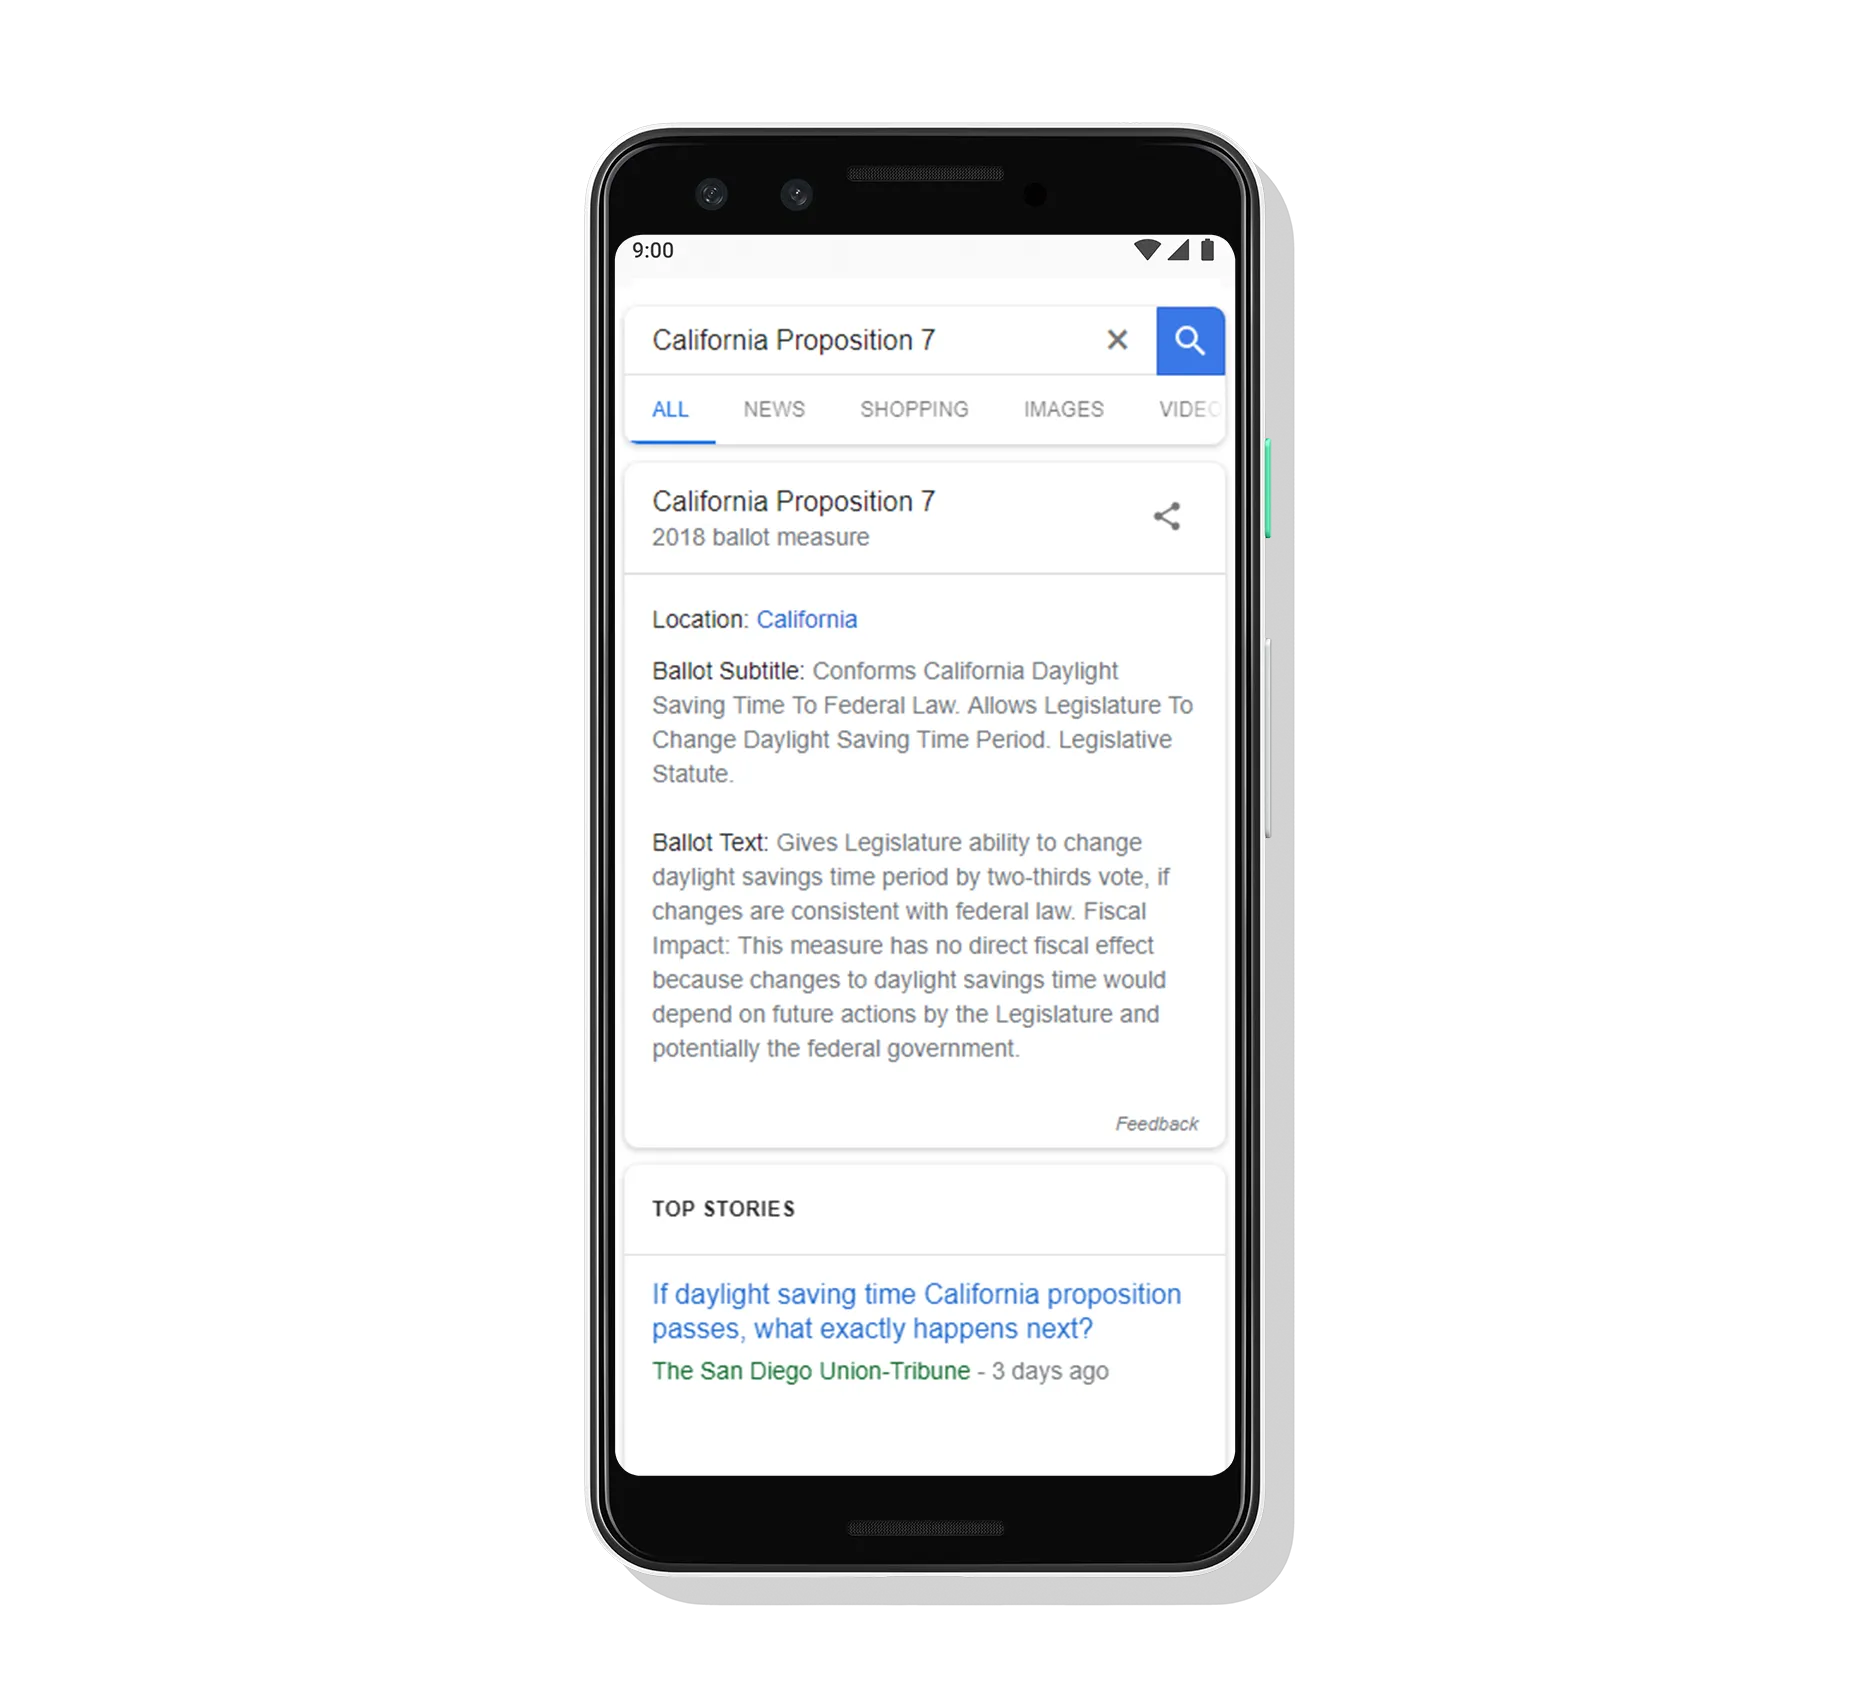
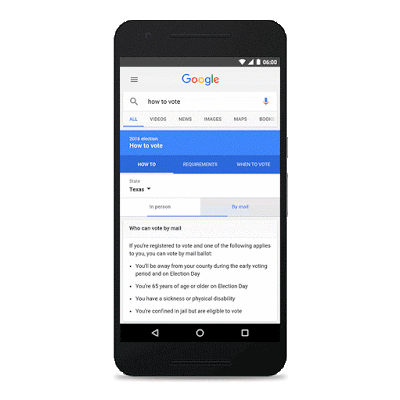
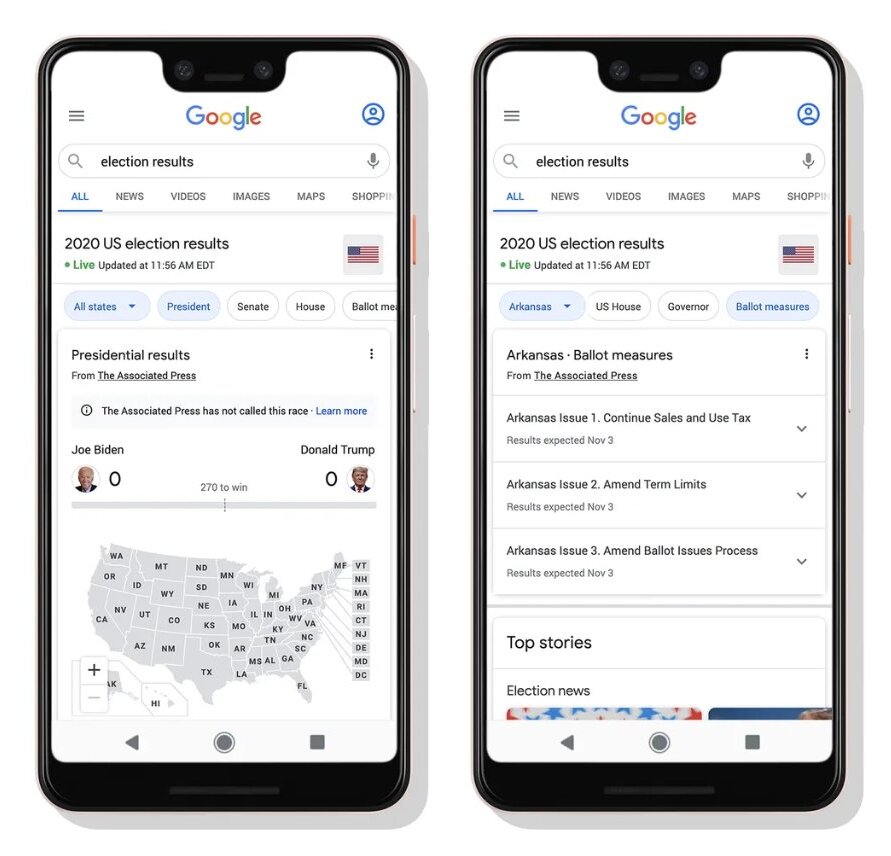
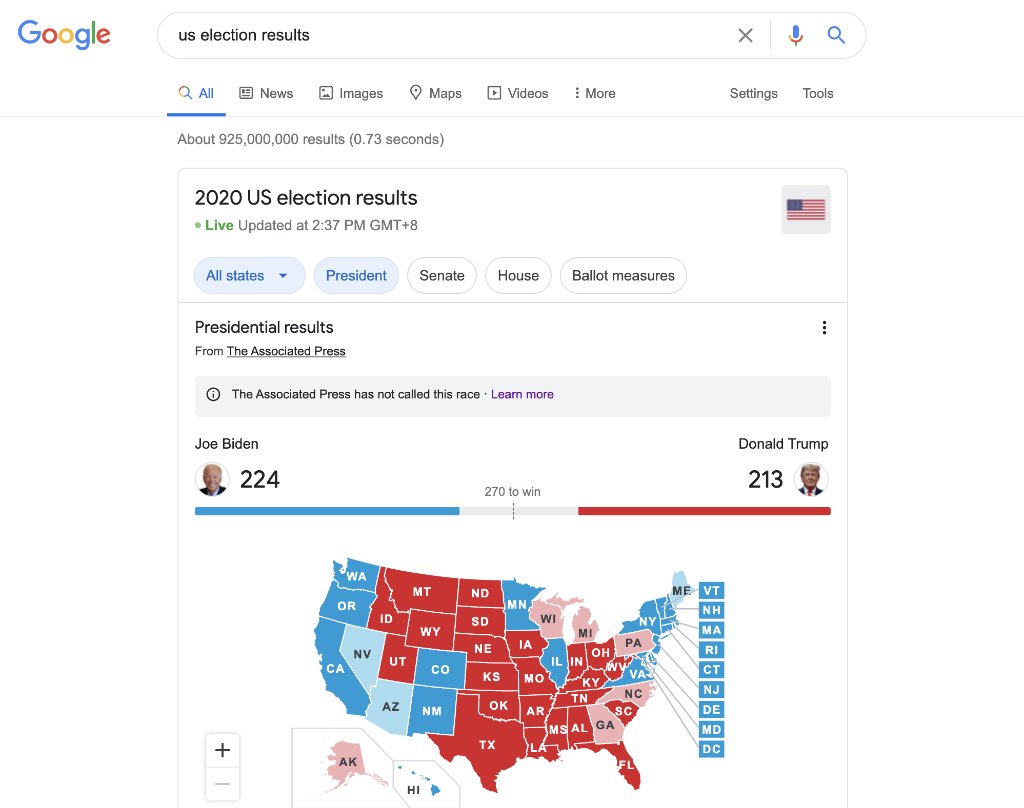
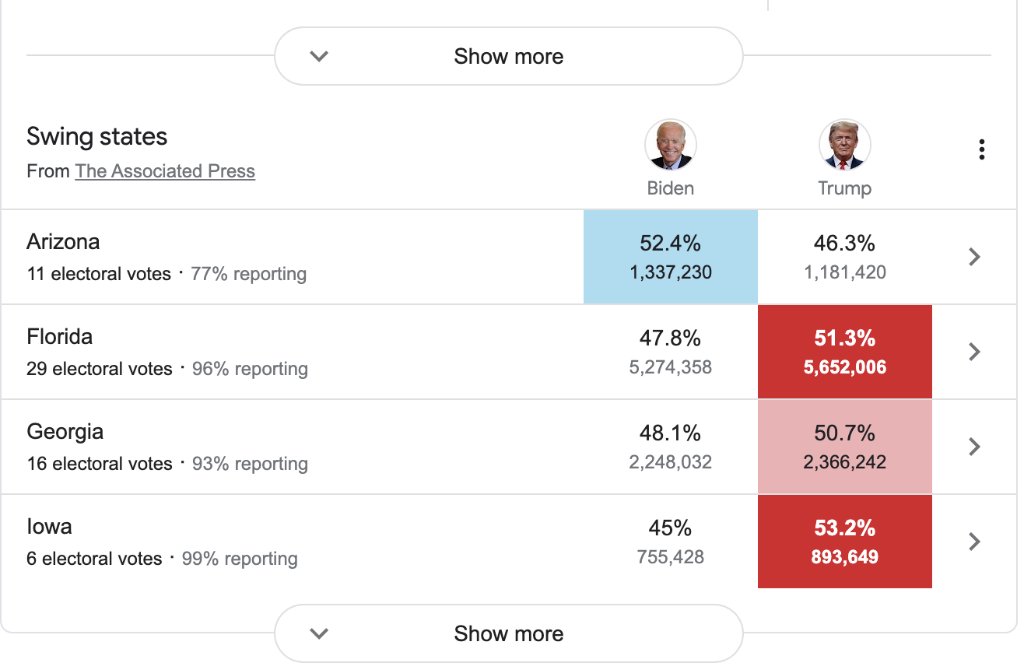
Election results for US 2016 and 2020 and international elections; voter assistance (how to register, how and where to vote).
TV & Movies
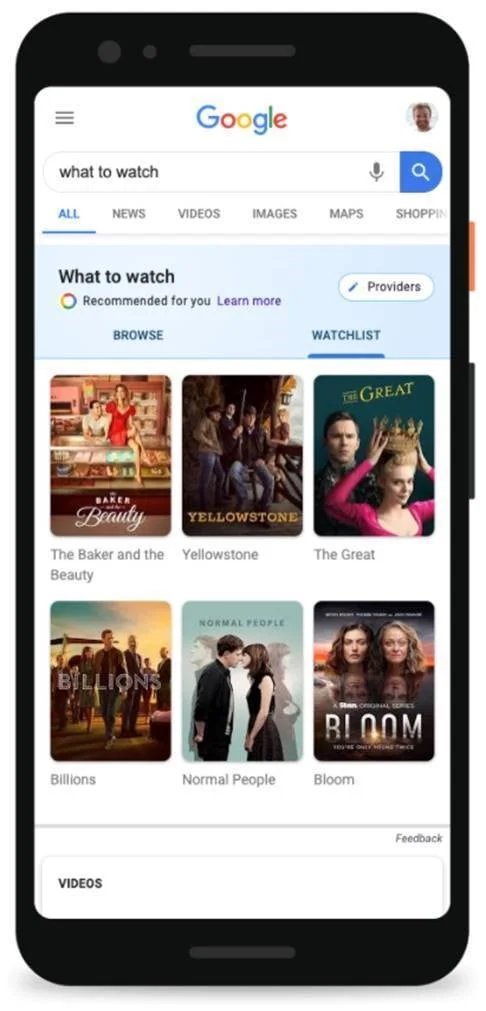
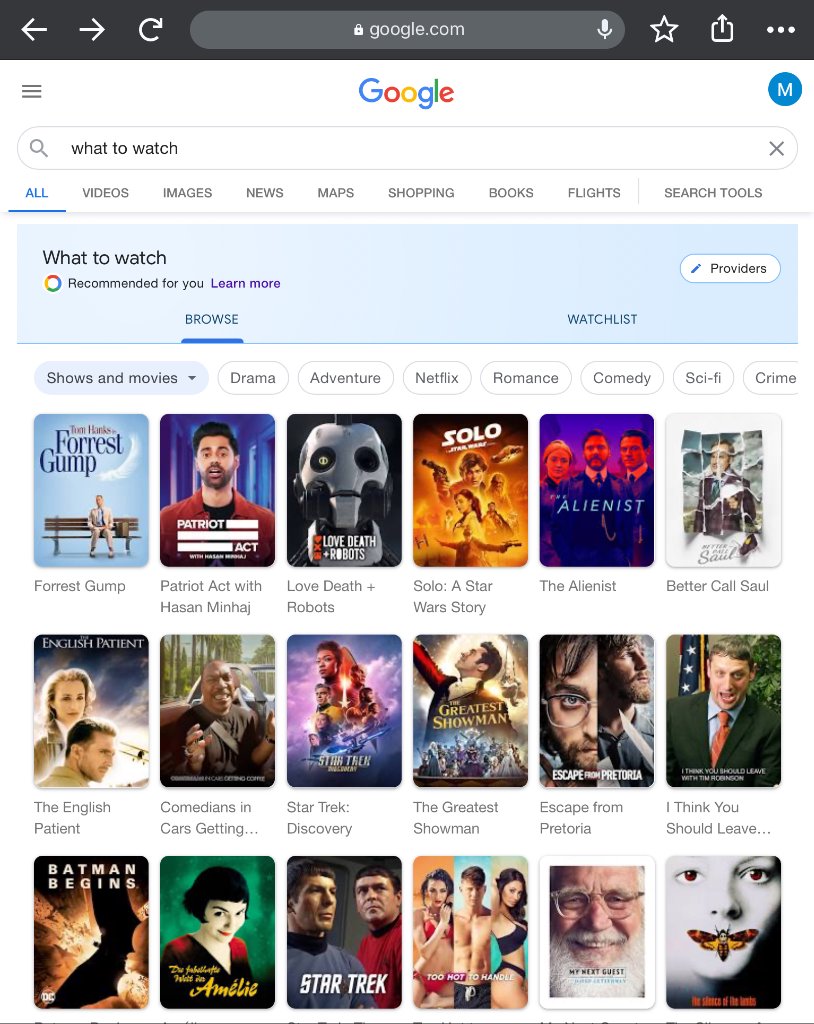
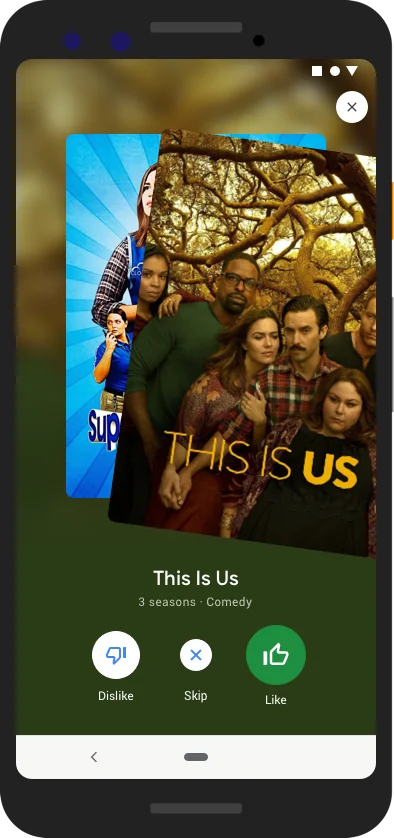
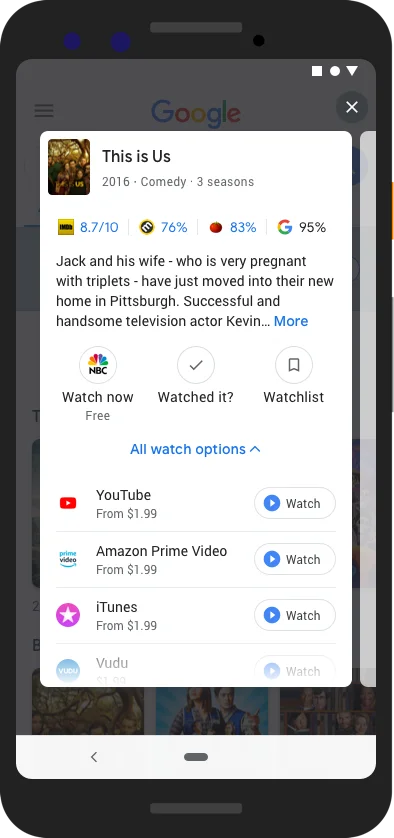
What to Watch: personalized TV and movie recommendations across the services you subscribe to.
Education
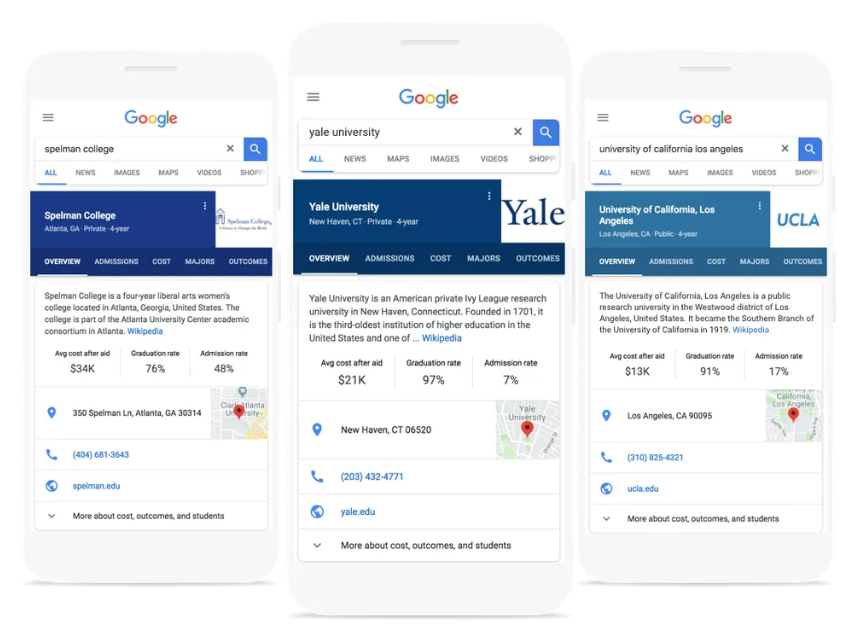
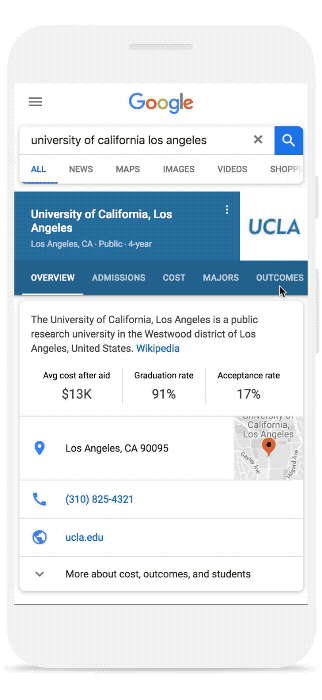
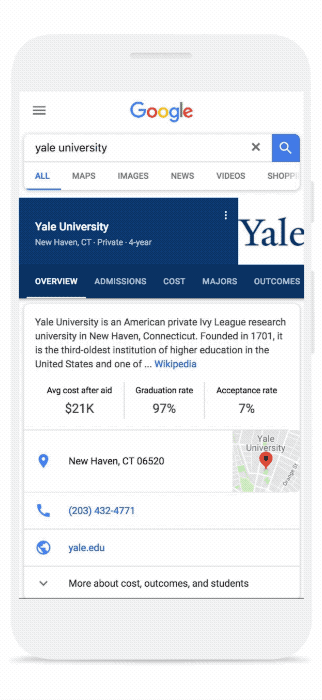
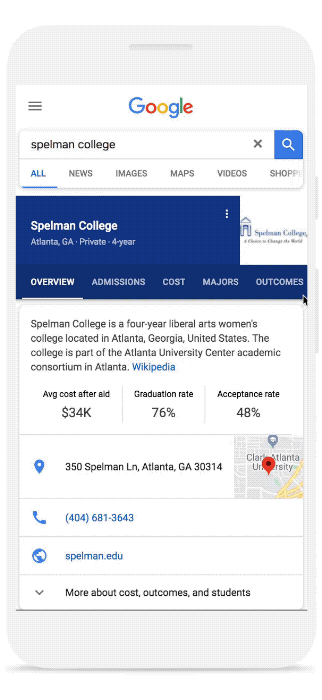
College knowledge panels and college search on Search, built on U.S. Department of Education data. Showing average cost after aid, broken down by household income, gave users a more accurate picture of what they would actually pay for college versus the advertised sticker price, alongside graduation rates, acceptance rates and outcomes.
Public data
First interactive data visualization in Search: public statistics (population, unemployment, GDP and more) rendered as explorable charts directly on the results page.
Weather
Weather on Search: a full-screen forecast with current conditions, hourly and 10-day views, and illustrated conditions. First native implementation of the Immersive framework.
Crisis Response
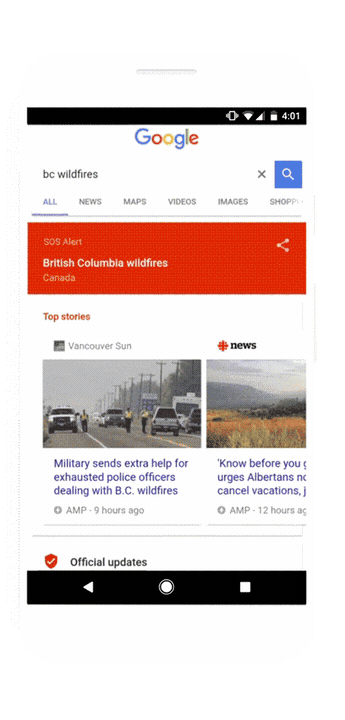
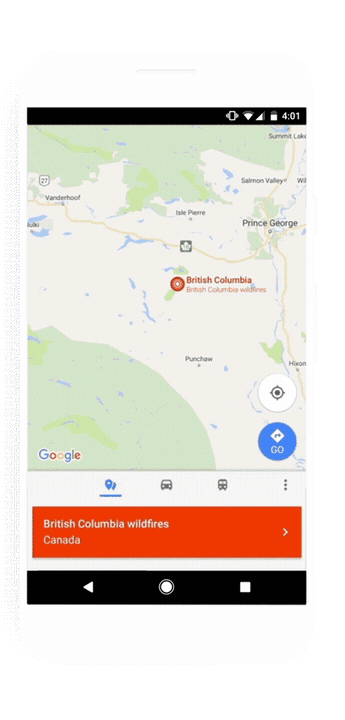
Crisis response cards: SOS Alerts on Search and Maps with official updates, emergency numbers and maps during natural disasters and other emergencies. Helping people in a crisis (blog.google)
0→1 launches
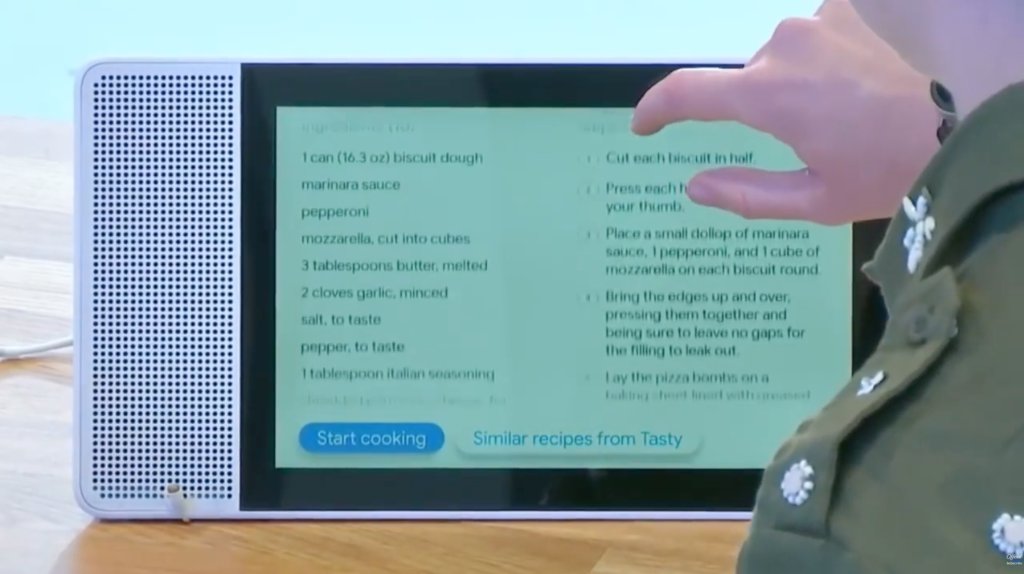
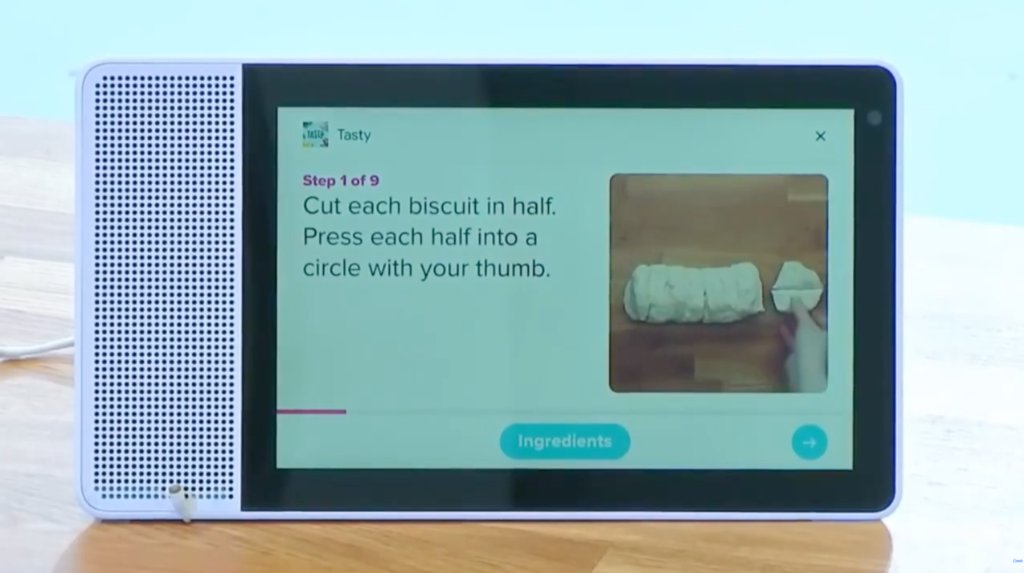
Google Stories; Cooking for mobile and smart displays.
- Grew the Shopping UX team from 9 to 20. Founded the Shopping UX Engineering team and established real-data prototyping as the primary evaluation method for all launch approvals.
- Grew the Verticals UX team from 1 to 30+ across New York, Mountain View, Tel Aviv, Bangalore and Seoul, covering ~51% of Search queries; 5 verticals over 1B MAU. Co-founded Search’s real-data prototyping team.
- Secured a ~5,000-person ongoing UX research panel with a stable cohort — a first for Search.
- 96%+ manager satisfaction scores over 15 years of leadership on internal report cards.
- New York University — ITP (Interactive Telecommunications Program), M.P.S.
- New York University — B.A., Politics & Economics
pithcell@gmail.com · +1-631-398-3129 · LinkedIn